Basically, we could plot either the R chart or the S chart to accompany the X chart to monitor the process control. R chart and S chart shows the spread of the data we collected.
But most books do not touch much on S chart. In the older days it is quite difficult to calculate S (S stand for Standard Deviation), therefore S chart is less popular.
We use the same example as in Part 3, in state of the calculating the average and range, now we calculate the average and standard deviation.

STEP 1: Subgroup Average
This step is same as what we have shown earlier in X-R Control Chart (Part 3).
STEP 2: Subgroup S
In state of R now we calculate the S value for each subgroup as follows,


STEP 3: Construct the table for X-S
To calculate the S value one by one using calculator it will take ages to do it. But if use uses Excel or other spreadsheet we can easily calculate the standard deviation of sample by formulas.

Above Table, I use formulas in Excel to construct. For average, simply =AVERAGE(B4:F4) and for standard deviation simply =STDEV(B4:F4) , if first subgroup data 1 to 5 is in cells B4:B5.
STEP 4: Calculate Control Limit
For X chart,


In this case A3 is 1.427 and average of all subgroup is 3.10

Notice the result is almost same as what we get using average of range in Part 3.
For S chart,


The data use to calculate the control limit normal should not be the same set of data that we use to plot the X-S chart. But for education purpose, I show how we do it using the same set of data.
STEP 5: Plot the X Chart and S Chart
First, plot X chart with data of each X (average) against the subgroup with control limit line for X chart as shown below.

Next, plot S chart with data of each S against the subgroup with control limit line for S chart as shown below

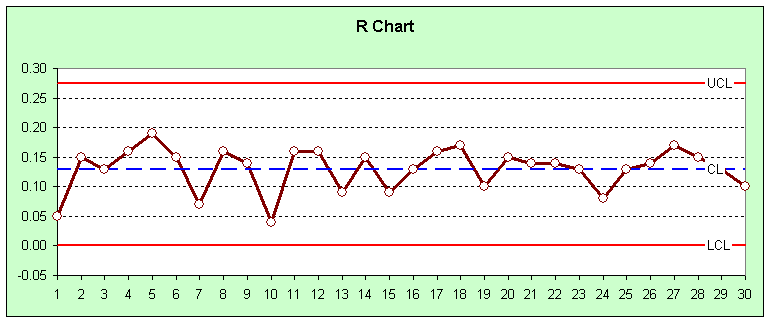
Now compare this chart with the R chart (Part 3), its point up and down is the same. The difference is only the y-axis scales and the value of the UCL, LCL and CL.
What this tell us is that the R chart and S chart actually shows us the same information for those set of data. The spread of the subgroup data.
Normally when the sample size is relatively small i.e. less than 10, range is used instead standard deviation. A typical choice of n for X-R chart is either 4 or 5.
No comments:
Post a Comment